
PausAR Metrics: Analytics for PausAR 3D & AR Viewers
Understand Your PausAR 3D & AR Viewer Performance
See how visitors interact with your 3D models and Augmented Reality experiences – privacy-friendly, lightweight and perfectly integrated into your WordPress dashboard.
Requires: PausAR – 3D & AR for Elementor
How are your 3D models used?
The Challenge
You’ve created impressive 3D model viewers and Augmented Reality experiences on your WordPress website with PausAR 3D & AR for Elementor – but do you really know how your visitors interact with them?
- Which 3D models get the most attention?
- How many visitors actually start AR sessions?
- On which pages do 3D & AR work best?
- How does usage develop over time?
Valuable 3D & AR viewer insights
The Solution
PausAR Metrics gives you answers to exactly these questions. The add-on precisely tracks how visitors interact with your PausAR 3D viewers and AR features – completely privacy-compliant and without external servers.
- 3D Viewer Interactions – per Page and 3D Viewer
- QR Code Generations – Desktop to Mobile AR
- AR Session Starts – Real Augmented Reality usage
- Apple vs. Android – Platform-specific insights
Why PausAR Metrics
Data-Driven Decisions for Your 3D & AR Strategy
Get valuable insights into the performance of your 3D/AR content.
Actionable Insights
Visually prepared data with interactive charts, donut diagrams and sortable tables. Understand at a glance what works.
Lightweight & Fast
Minimal JavaScript code, no external requests. Does not affect the performance of your 3D & AR viewers and loads asynchronously in the background.
AR Platform Insights
See exactly whether your AR users are using Apple (iOS, iPadOS, visionOS) or Android (Phones, Tablets, XR Headsets)
Widget-Level Tracking
Every PausAR widget is tracked individually. See exactly which 3D model performs best on which page and which AR Experience is loved most.
Perfectly PausAR Integrated
Seamless integration into PausAR 3D & AR for Elementor. Works automatically with all existing and new 3D & AR widgets – without extra configuration.
Export Options & E-Mail Reports
Export your data to Excel or PDF and receive weekly or monthly email summaries with trends, top performers and comparisons.
Upgrade your PausAR Integration to the next Level
Powerful Features for Data-Driven 3D & AR Optimization
Everything you need to understand your AR performance.
All the PausAR data you need
Interactive Analytics Dashboard
Visualize your 3D & AR performance in a clear dashboard directly in WordPress. With interactive line charts for timelines, donut charts for event distributions and summary cards for quick overviews.
- Timeline chart shows 3D viewer interactions, QR codes and AR starts over time
- Event distribution and AR launches by Device donut charts for quick insights into user behavior
- Summary cards with overall metrics at a glance
- URL filter to restrict analysis to specific areas


Your key metrics at a glance – without opening the plugin
Dashboard Widget
Stay on top of your PausAR 3D & AR performance without navigating away from your WordPress Dashboard. The built-in dashboard widget displays your total interactions for the last 7 days and today.
- Compact widget on the main WordPress Dashboard page
- 7-day and today totals for all interaction types
- Can be optionally disabled in the settings
Spot trends before they become problems
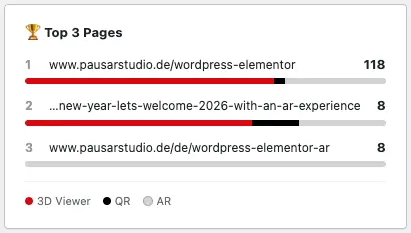
Top Performers, Rising Stars & Needs Attention
See your 3 best-performing pages ranked by total interactions, with colour-coded bars showing the 3D Viewer, QR, and AR split. Rising Stars highlights pages gaining momentum, while Needs Attention flags declining engagement.
- Top 3 Pages ranked by total interactions with colour-coded breakdown bars
- Rising Stars: Top 3 pages with the biggest growth vs. previous period
- Needs Attention: Top 3 pages with the biggest decline vs. previous period
- Adapts to your selected date range and URL filter


Detailed per PausAR widget Analytics
Sortable Data Table
Analyze in detail which pages generate the most 3D & AR interactions. Sort by viewer interactions, QR codes, AR launches or widget count.
- All pages with PausAR widgets clearly listed
- Sort by various metrics with a click
- Widget count per page for context
- Drill-down to individual widgets and 3D models
- Export to Excel (XLSX) with one click
Discover how users interact with your 3D models and AR Experiences
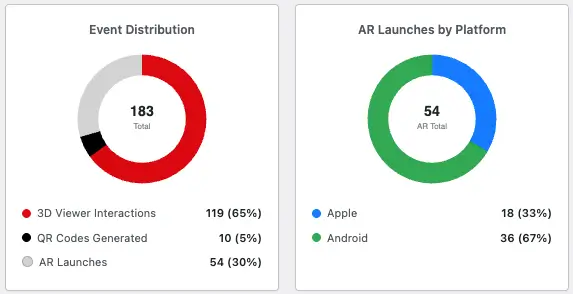
Device and Event Distribution Analysis
Understand on which platforms your 3D model perform best and how often your AR experiences are launched. See how AR sessions are distributed between Apple (.usdz, .reality) and Android (.glb) devices.
- Donut chart for event distribution (3D viewer interactions, QR codes generated, AR launches)
- Separate donut chart AR platform distribution
- Apple AR Devices: iPhone, iPad, Apple Vision Pro
- Android AR Devices: Phones, Tablets, Android XR Headsets


See how your performance evolves over time
Compare Current vs. Previous Period
The toggle overlays dashed lines from the previous period. See whether your 3D & AR performance is are trending up or down.
- Tooltip shows current vs. previous values for every data point
- Available for all date ranges, except 365 days
Give your data the context it needs
Chart Annotations / Notes
Highlight important events directly on your timeline with colour-coded annotations. Markers appear on the chart with details in the tooltip, and are included in PDF exports.
- Add colour-coded annotations to any date on the timeline
- Perfect for tracking the impact of campaigns, launches, or website changes


Weekly or Monthly Reports right to your Inbox
Automatic E-Mail Reports
- Weekly reports (every Monday) or monthly (1st of the month)
- Total interactions with trend comparisons to previous period
- Top 5 pages by performance – your most successful 3D & AR content
Professional reports in one click
Branded PDF Report Export
Export a polished, print-ready PDF report of your analytics data with a single click. Each report includes KPI summary cards, the interactive line chart with annotations, donut charts for event and platform distribution, and a top pages table with mini bar charts.
- Branded PDF with KPI cards, line chart, donut charts, and top pages table
- Customise with your own logo, name and accent colour in Settings
- Uses your currently selected time period and URL filter
- Ideal for client reporting, presentations, and archiving


Export your analytics data
XLSX Export Option
Export and download your data with one click and continue working with it in Excel or other tools. All metrics included: 3D Viewer Interactions, QR Codes Generated, AR Launches and Widget details.
- Export filtered data – only the time periods and pages you need
- Ideal for long-term archiving
Make data-driven decisions for your 3D & AR strategy
How PausAR Metrics Works
Easy installation, automatic tracking, meaningful insights – no technical knowledge required.
1
Install Plugin
Install PausAR Metrics from the WordPress plugin directory or upload the ZIP file. Activate the plugin with one click.
2
Automatic Tracking
PausAR Metrics automatically detects all existing and new PausAR 3D & AR widgets on your website – immediately after activation. No manual configuration needed.
3
Gain Insights
Open the PausAR Metrics dashboard in your WordPress admin. Analyze your 3D & AR models performance with interactive charts, sortable tables and summary cards.
Privacy-Friendly Analytics for PausAR 3D & AR viewers
What is Tracked?
Track QR-Code views, AR launches, and 3D viewer interactions for each 3D model individually. Only PausAR 3D & AR Experience are tracked.
3D Viewer Interaction
Counted once per widget and page visit as soon as a visitor interacts with the 3D model (rotate, zoom, explore). Multiple 3D Viewers on one page are counted separately.
QR Code Popup Generation
Counted when the AR button is clicked on a desktop (not AR-capable) device and the QR code popup is displayed (for mobile AR transfer).
Augmented Reality Session Start
Counted when the Start AR button is clicked or AR autostart is triggered on an AR-capable device. Incl. platform detection (Apple or Android).
Privacy-Friendly Analytics
PausAR Metrics collects no personal data
No cookies, no IP addresses, no device-fingerprinting, no external connections. Only aggregated counters (event type, page URL, widget ID, date and time) are stored in your WordPress database for a maximum of 365 days depending on your setting. Also all stored data can be deleted manually at any time.
Feature Comparison Free vs. Pro
Free vs. Pro – Which Version Suits You?
Start for free with the basic features or get the most out of your PausAR powered 3D & AR analytics with Pro.
PausAR Metrics
Features:
Free
0 €
Pro
from 2,99 € / month
- 14-Day Money-Back Guarantee
Transparent Pricing – No Hidden Costs
Start for free or upgrade to PausAR Metrics Pro for advanced analytics and automated reports. You can cancel at any time.
- Save 30%
Free
0 €
forever
Perfect for getting started with PausAR 3D & AR analytics with basic features.
- Interactive Analytics Dashboard
- Timeline & Donut Event Distribution Chart
- Sortable Data Table
- Top 3 Pages with Breakdown bars
- Dashboard Widget
- 7 Days Data Retention
Pro
35,88 € 24,99 €
/ year
For professional 3D & AR analytics with advanced features and support.
- All Free Features Included
- Up to 365 Days Data Retention
- Per-Widget Tracking & Statistics
- Apple vs. Android AR Breakdown
- Rising Stars & Needs Attention insights
- Chart Annotations
- Compare time periods
- Export to Excel (XLSX)
- Export PDF Report
- Automated Email Reports
- 1 Domain Licence
- Priority Email Support
Bundle
Coming
Soon
PausAR 3D & AR for Elementor Pro + Metrics Pro together in one package.
- Multi Domain Licences
- PausAR 3D & AR for Elementor Pro
- PausAR Metrics Pro
- Special Price (Bundle Discount)
Free
0 €
forever
Perfect for getting started with PausAR 3D & AR analytics with basic features.
- Interactive Analytics Dashboard
- Timeline & Donut Event Distribution Chart
- Sortable Data Table
- Top 3 Pages with Breakdown bars
- Dashboard Widget
- 7 Days Data Retention
Pro
2,99 €
/ month
For professional 3D & AR analytics with advanced features and support.
- All Free Features Included
- Up to 365 Days Data Retention
- Per-Widget Tracking & Statistics
- Apple vs. Android AR Breakdown
- Rising Stars & Needs Attention insights
- Chart Annotations
- Compare time periods
- Export to Excel (XLSX)
- Export PDF Report
- Automated Email Reports
- 1 Domain Licence
- Priority Email Support
Bundle
Coming
Soon
PausAR 3D & AR for Elementor Pro + Metrics Pro together in one package.
- Multi Domain Licences
- PausAR 3D & AR for Elementor Pro
- PausAR Metrics Pro
- Special Price (Bundle Discount)
All prices in Euro or USD2 excluding VAT.
1After termination of the license, functions are no longer available after the end of the term.
The sale is carried out by Freemius, based in the USA. During the payment process, you have the option of adding your VAT ID. You must also enter the VAT ID for orders from Germany, as the sale is processed by Freemius in the USA. The final price will be displayed on the checkout page.
2The exchange rate is calculated using a factor of 0.85 EUR = 1 USD and may differ from the current daily rate.
Most asked questions about PausAR 3D & AR Metrics
FAQ

Do I need PausAR 3D & AR for Elementor?
Yes, PausAR Metrics is an add-on for the PausAR 3D AR plugin. You need at least the free version of PausAR 3D AR to use Metrics. Read more about PausAR 3D & AR for WordPress with Elementor.
Where is my data stored?
All data is stored in your own WordPress database. There is no cloud connection and no data transfer to third parties. Also all your collected data can be deleted manually at any time.
What data is stored by PausAR Metrics?
Only aggregated interaction counters: event type (3D viewer interaction, QR code, AR start), page URL, widget ID, date and time. For AR launches, the platform (Apple or Android) is also included in the Pro version.
Does PausAR Metrics use cookies?
No! PausAR Metrics works completely without cookies. Tracking is based on aggregated event counters – no session IDs, no cookies, no personal identifiers.
Can I upgrade from Free to Pro?
Yes, you can upgrade (and downgrade) at any time. Your historical data (within the 7-day limit of the Free version) will be preserved.
Is there a money-back guarantee?
Yes! If you are not satisfied with PausAR Metrics Pro, you will receive your money back within 14 days of purchase.
Where can I find Support for PausAR plugins?
To get support please visit our Support page. We are happy to help you out!
You have built great 3D & AR Experiences with PausAR Viewer?
Now You Can Prove It.
PausAR Metrics makes sure you can provide valuable insights of your PausAR viewer powered 3D & AR experiences performance – to yourself, your clients, and anyone asking, at any time.
Less guessing. More coffee.
More Information about PausAR Metrics
Resources
Documentation
Installation
- Make sure PausAR – 3D & AR for Elementor is installed and activated (Free or Pro).
- Go to the plugin menu on the WordPress admin page.
- Click on “Add Plugin”.
- Search for “PausAR – 3D and AR Viewer Metrics” or manually add the plugin ZIP file.
- Activate the plugin in the plugin menu.
- Done! Data will appear under PausAR Metrics in the admin menu.
Data Collection
Activate or Deactivate Data Collection
After the activation of the PausAR Metrics plugin the data collection will automatically start.
If you want to stop the data collection you can do that in the settings menu of PausAR Metrics. You can re-activate it any time.

Change maximum data retention
PausAR Metrics can collect data up to 365 days in the Pro or 7 days of data in the Free version. Older data is automatically deleted.
If for some reason you want less days of collection you can choose from this settings: 7, 30, 90, 180, 365. Your selection will automatically change the available filter options and the export pages.
Be aware if you have collected 365 days of data and you reduce your retention period to e.g. 90 days older data will automatically be deleted!
If you upgrade from the Free to the Pro version the default data retention (7 days) will still be set. You can easily change this to a longer period on the settings page.
If you downgrade from Pro to Free the duration that you had set in the Pro plan will change to 7 days. All older data will be deleted automatically in the daily cleanup.

Data Export
Export a custom branded PDF
PausAR Metrics lets you export a branded PDF report of the most important data in your selected time period. The button PDF Export on the Analytics page also includes the URL filter (if you used it).
The PDF includes the KPIs, the line chart (including annotations), the Donut charts for Interaction Distribution and AR Launches by Platform, and the table sorted by total interactions (visualized with the colored bar).
You can brand this PDF with your Logo, name and accent color in the Settings menu. Per default the values are the PausAR Metrics Logo, PausAR Metrics name and #db0812 (PausAR red) accent color (see example PDF).
The title of the PDF (PausAR Studio in the picture) is automatically generated from your Website title.
In this example the Logo would be the PausAR Studio cube, the name PausAR Studio and the accent color #db0812.

Export all data to XLSX (Excel)
PausAR Metrics can export your collected data to XLSX so that you can either archive it or work with it further. There are two options of data that can be exported.
Option 1 - Export all page Data
On the first menu point of PausAR Metrics (Analytics) you can export the data by URL. Meaning for your whole website all collected data will be exported. The URL or date Filter will work also so you could export all pages data under the path /products/ for example.

Option 2 - Export per page Data
The second option is per widget data. If you have one website page (in our case our PausAR Viewer Landingpage) that contains multiple PausAR 3D & AR Viewer widgets you might be interested in comparing them. This you can do in the “Detailed Pageview” menu point of PausAR Metrics. If you export to XLSX on that page it will export just this page with all widgets separated.
E-Mail Summary
Monthly or Weekly E-Mail Summary
PausAR Metrics can send stylized E-Mail Summaries of the last period (either month or week) comparing to the period before to your inbox. You can test the setting using the “Send Test Email” button. This will send you a summary of todays data against yesterday. the Email also shows the top 5 pages (in regard to PausAR Metrics data).

Delete Data
Delete specific or all Data
In the settings menu you can either delete all PausAR Metrics data, which deletes all ever recorded Metrics stats or you can delete specific pages or paths. If you fill in a path and not a complete URL it will delete all data under this path so /products/ would delete all data containing the products path. Entering a full URL will delete all data matching that exact URL (e.g. www.pausarstudio.de/products/product-1/ -> deletes all data of product 1.
Be aware once the data is deleted there is no going back!

Uninstall
Change uninstall Behaviour
Uninstalling PausAR Metrics is the same as any other plugin just deactivate and delete/uninstall PausAR Metrics on the plugin page.
However before you do that be aware that on default if you delete PausAR Metrics, also all collected data will be completely deleted. If you want to keep your data you can activate the checkbox on the settings page. The uninstall behaviour also deletes (or keeps) your annotation notes.

Change log
v.1.0
1.0.7
15.03.2026
- Added: Page selection checkboxes – select pages in the table to filter chart and KPIs
- Added: AR platform breakdown (Apple vs Android) now available in the free version
- Removed: Custom update checker
- Removed: Freemius add-on migration helper (no longer needed)
1.0.6
09.03.2026
- Improved: Modular chart script architecture
- Improved: Streamlined data retention settings
- Improved: Changes on admin pages regarding WordPress.org compliance
- Fixed: PDF export error when using the 7-day time range (Pro)
- Fixed: Line chart not rendering in PDF export for certain time periods (Pro)
1.0.5
02.03.2026
- Improved: Modular chart script architecture
- Improved: Streamlined data retention settings
1.0.4
24.02.2026
- Changes regarding WordPress.org compliance
- Fixed: Removed dead code and variables from the free build
- Fixed: Cleaned up premium-referencing comments and function documentation
1.0.3
22.02.2026
- Fixed: Removed all Pro-only code artifacts from the free build to comply with WordPress.org guidelines (annotations table, XLSX export handler, email report settings, AJAX stubs)
- Fixed: Responsive layout – KPI cards and donut charts no longer overlap on narrow screens
- Improved: Added directory listing protection (index.php) to all plugin folders
- Added top 3 pages section on the analytics page with colour-coded interaction breakdown bars
- Added rising stars insight – pages with the biggest percentage increase vs. previous period (Pro)
- Added needs attention insight – pages with the biggest percentage drop vs. previous period (Pro)
- Added comparison mode – overlay dashed lines from the previous period in the line chart with tooltip support (Pro)
- Added PDF report export with full analytics view: line chart with annotations, donut charts, KPI cards, and top pages table (Pro)
- Added PDF report export branding settings – logo upload via media library, custom name field, and accent color picker (Pro)
1.0.2
21.02.2026
- Improved free/pro code separation for WordPress.org compliance
- Converted inline scripts and styles to use wp_enqueue functions
- Updated footer links
1.0.1
19.02.2026
- Added “Delete by URL” option on the Settings page to remove data for specific pages
- Added AR Apple and AR Android columns to the detailed page export (Pro)
- Added optional hour selection for notes on the Today view (Pro)
- Added date picker on Today tab to view historical daily data with day-by-day navigation
- Updated plugin description and footer links
1.0.0
14.02.2026
- Initial release